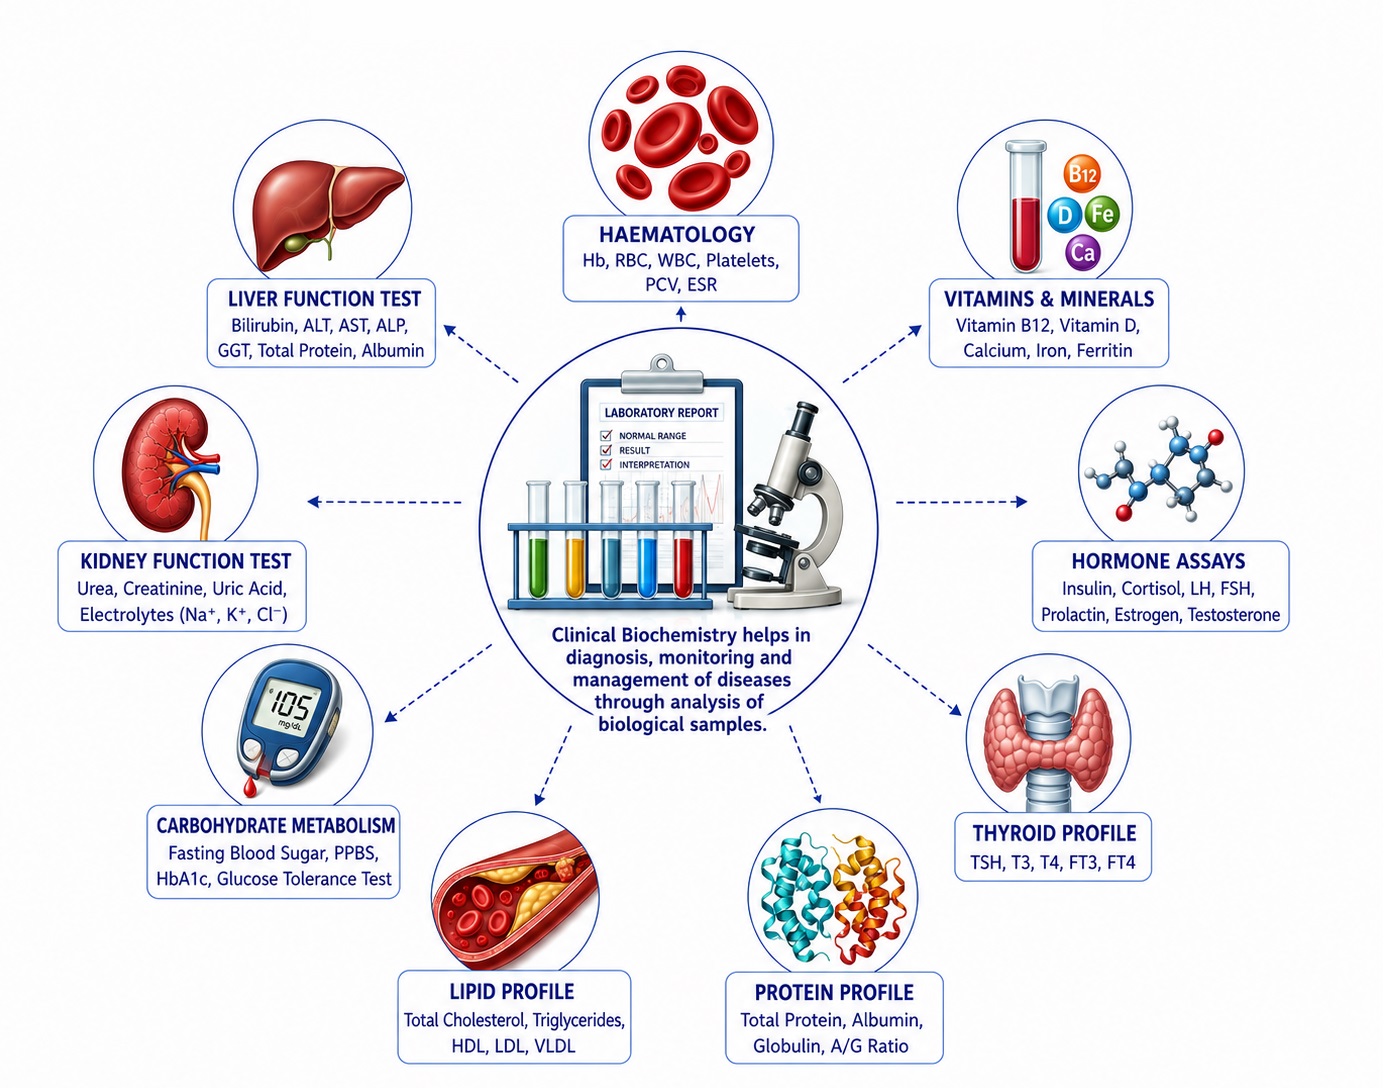
Clinical Biochemistry is the branch of laboratory medicine that analyzes biochemical constituents of blood, urine, cerebrospinal fluid (CSF), and other body fluids. These laboratory parameters provide critical information about organ function, metabolic status, endocrine activity, nutritional health, and disease processes.
Reference intervals represent values observed in healthy populations and may vary slightly depending on age, sex, ethnicity, laboratory methodology, and instrumentation. Understanding normal biochemical values is essential for diagnosing diseases, monitoring treatment, assessing prognosis, and conducting preventive health screening.
1. Carbohydrate Metabolism and Diabetes Profile
Carbohydrate metabolism tests assess glucose homeostasis, pancreatic β-cell function, and insulin sensitivity.
Blood Glucose Parameters
| Parameter |
Reference Range |
| Fasting Plasma Glucose (FPG) |
70–99 mg/dL |
| Random Blood Glucose |
<140 mg/dL |
| 2-Hour Postprandial Glucose |
<140 mg/dL |
| Oral Glucose Tolerance Test (2-hour) |
<140 mg/dL |
| HbA1c |
4.0–5.6% |
| Estimated Average Glucose (eAG) |
70–114 mg/dL |
Diabetes Diagnostic Cut-Offs
| Parameter |
Prediabetes |
Diabetes |
| Fasting Plasma Glucose |
100–125 mg/dL |
≥126 mg/dL |
| HbA1c |
5.7–6.4% |
≥6.5% |
| OGTT (2-hour) |
140–199 mg/dL |
≥200 mg/dL |
Insulin and Related Markers
| Parameter |
Reference Range |
| Fasting Insulin |
2–25 μIU/mL |
| C-Peptide |
0.8–3.5 ng/mL |
| HOMA-IR |
<2.0 |
2. Renal Function Tests (RFT)
Renal function tests evaluate glomerular filtration, tubular function, and nitrogen waste elimination.
Nitrogenous Waste Products
| Parameter |
Reference Range |
| Blood Urea Nitrogen (BUN) |
7–20 mg/dL |
| Serum Urea |
15–45 mg/dL |
| Creatinine (Male) |
0.7–1.3 mg/dL |
| Creatinine (Female) |
0.6–1.1 mg/dL |
| BUN/Creatinine Ratio |
10:1–20:1 |
Renal Clearance Parameters
| Parameter |
Reference Range |
| eGFR |
>90 mL/min/1.73m² |
| Creatinine Clearance |
90–140 mL/min |
| Uric Acid (Male) |
3.4–7.0 mg/dL |
| Uric Acid (Female) |
2.4–6.0 mg/dL |
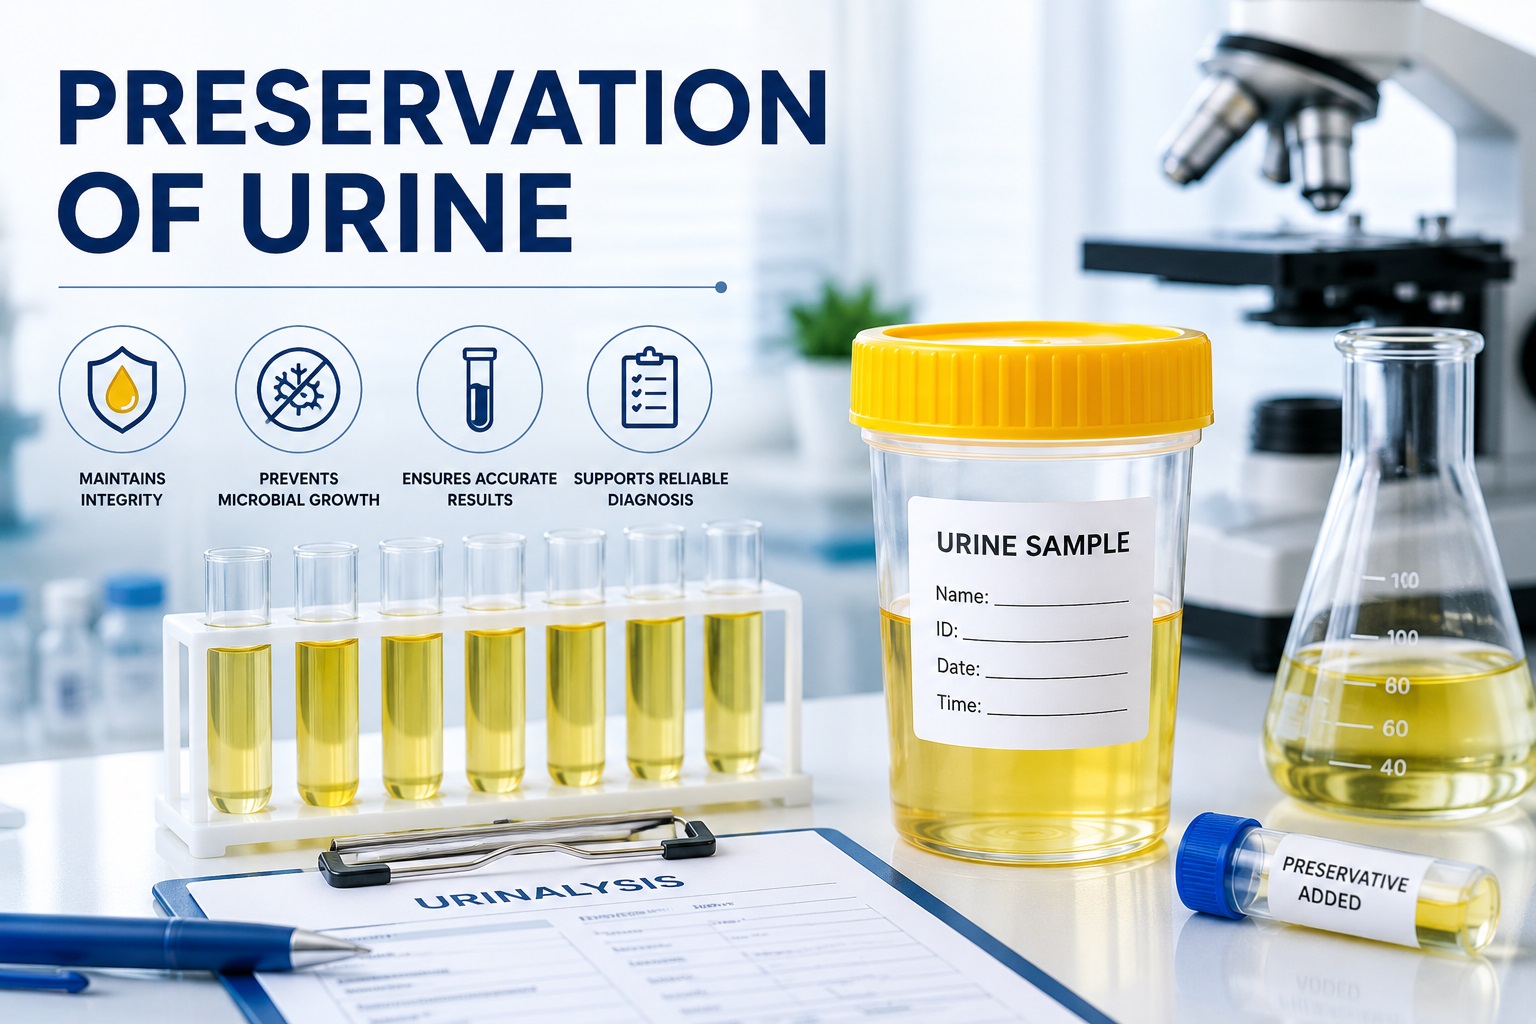
Urinary Protein Assessment
| Parameter |
Reference Range |
| Microalbumin |
<30 mg/day |
| Total Urine Protein |
<150 mg/day |
| Albumin-Creatinine Ratio |
<30 mg/g |
3. Electrolyte Profile
Electrolytes maintain osmotic balance, acid-base equilibrium, muscle contraction, and nerve conduction.
Major Electrolytes
| Parameter |
Reference Range |
| Sodium (Na⁺) |
135–145 mmol/L |
| Potassium (K⁺) |
3.5–5.0 mmol/L |
| Chloride (Cl⁻) |
98–107 mmol/L |
| Bicarbonate (HCO₃⁻) |
22–28 mmol/L |
Mineral Electrolytes
| Parameter |
Reference Range |
| Total Calcium |
8.5–10.5 mg/dL |
| Ionized Calcium |
4.5–5.6 mg/dL |
| Magnesium |
1.7–2.4 mg/dL |
| Phosphorus |
2.5–4.5 mg/dL |
Osmolality
| Parameter |
Reference Range |
| Serum Osmolality |
275–295 mOsm/kg |
| Urine Osmolality |
300–900 mOsm/kg |
4. Liver Function Tests (LFT)
Liver function tests evaluate hepatocellular injury, cholestasis, and hepatic synthetic function.
Hepatocellular Enzymes
| Parameter |
Reference Range |
| ALT (SGPT) |
7–56 U/L |
| AST (SGOT) |
10–40 U/L |
| LDH |
140–280 U/L |
Cholestatic Enzymes
| Parameter |
Reference Range |
| Alkaline Phosphatase (ALP) |
44–147 U/L |
| Gamma GT (GGT) |
9–48 U/L |
| 5’-Nucleotidase |
2–17 U/L |
Bilirubin Profile
| Parameter |
Reference Range |
| Total Bilirubin |
0.3–1.2 mg/dL |
| Direct Bilirubin |
0.0–0.3 mg/dL |
| Indirect Bilirubin |
0.2–0.9 mg/dL |
Synthetic Function
| Parameter |
Reference Range |
| Albumin |
3.5–5.0 g/dL |
| Total Protein |
6.0–8.3 g/dL |
| Globulin |
2.0–3.5 g/dL |
| A/G Ratio |
1.0–2.2 |
5. Lipid Profile
Lipid testing evaluates cardiovascular disease risk and metabolic syndrome.
Standard Lipid Panel
| Parameter |
Desirable Value |
| Total Cholesterol |
<200 mg/dL |
| LDL Cholesterol |
<100 mg/dL |
| HDL Cholesterol (Male) |
>40 mg/dL |
| HDL Cholesterol (Female) |
>50 mg/dL |
| Triglycerides |
<150 mg/dL |
| VLDL Cholesterol |
5–40 mg/dL |
| Non-HDL Cholesterol |
<130 mg/dL |
Advanced Lipid Markers
| Parameter |
Reference Range |
| ApoA1 |
110–180 mg/dL |
| ApoB |
60–120 mg/dL |
| Lipoprotein(a) |
<30 mg/dL |
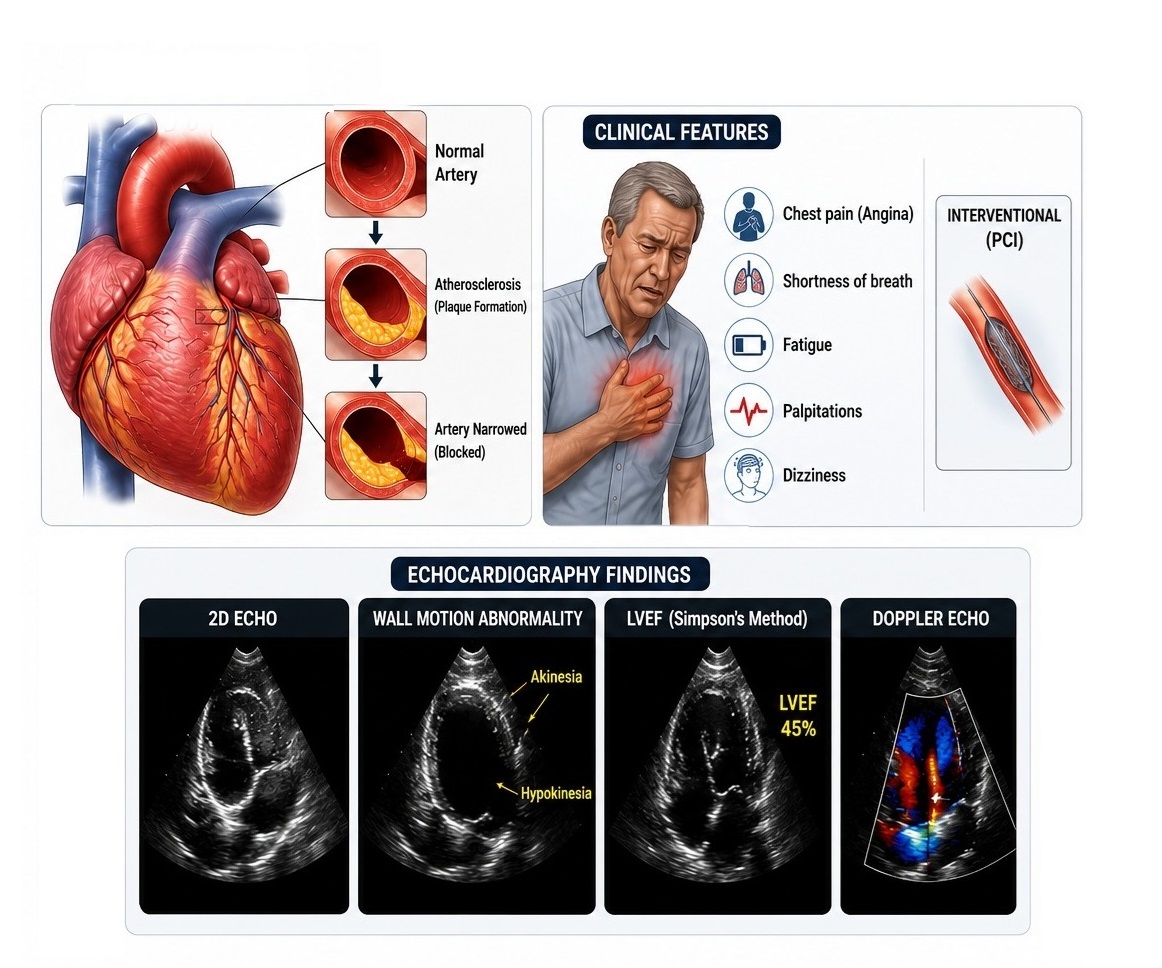
6. Cardiac Biomarkers
Cardiac biomarkers help diagnose myocardial infarction and heart failure.
| Parameter |
Reference Range |
| Troponin I |
<0.04 ng/mL |
| Troponin T |
<0.01 ng/mL |
| CK-MB |
0–5 ng/mL |
| Total CK |
30–200 U/L |
| Myoglobin |
25–72 ng/mL |
| BNP |
<100 pg/mL |
| NT-proBNP |
<125 pg/mL |
7. Pancreatic Function Tests
Used primarily in acute and chronic pancreatitis.
| Parameter |
Reference Range |
| Serum Amylase |
30–110 U/L |
| Urine Amylase |
2–25 U/hr |
| Serum Lipase |
13–60 U/L |
8. Thyroid Function Tests
Assessment of thyroid gland activity and metabolic regulation.
Thyroid Hormones
| Parameter |
Reference Range |
| TSH |
0.4–4.5 mIU/L |
| Free T4 |
0.8–1.8 ng/dL |
| Total T4 |
5–12 μg/dL |
| Free T3 |
2.3–4.2 pg/mL |
| Total T3 |
80–200 ng/dL |
Thyroid Antibodies
| Parameter |
Reference Range |
| Anti-TPO Antibody |
<35 IU/mL |
| Anti-Thyroglobulin Antibody |
<40 IU/mL |
| TSH Receptor Antibody |
<1.75 IU/L |
9. Adrenal Function Tests
Assessment of adrenal cortical and medullary activity.
| Parameter |
Reference Range |
| Morning Cortisol |
5–25 μg/dL |
| Evening Cortisol |
2–14 μg/dL |
| ACTH |
10–60 pg/mL |
| Aldosterone |
4–31 ng/dL |
| Plasma Renin Activity |
0.6–4.3 ng/mL/hr |
10. Reproductive Hormones
Male Hormones
| Parameter |
Reference Range |
| Total Testosterone |
300–1000 ng/dL |
| Free Testosterone |
5–25 ng/dL |
| LH |
1.5–9.3 IU/L |
| FSH |
1.4–18.1 IU/L |
Female Hormones
| Parameter |
Reference Range |
| Estradiol |
30–400 pg/mL* |
| Progesterone |
0.2–25 ng/mL* |
| LH |
1.9–12.5 IU/L* |
| FSH |
3–20 IU/L* |
| Prolactin |
5–25 ng/mL |
*Values vary according to menstrual cycle phase.
11. Bone and Mineral Metabolism
Calcium Homeostasis
| Parameter |
Reference Range |
| Total Calcium |
8.5–10.5 mg/dL |
| Ionized Calcium |
4.5–5.6 mg/dL |
| Phosphorus |
2.5–4.5 mg/dL |
| Magnesium |
1.7–2.4 mg/dL |
Bone Biomarkers
| Parameter |
Reference Range |
| Vitamin D (25-OH) |
30–100 ng/mL |
| Parathyroid Hormone |
10–65 pg/mL |
| Osteocalcin |
8–32 ng/mL |
12. Iron Studies
Evaluation of anemia and iron metabolism disorders.
| Parameter |
Reference Range |
| Serum Iron |
60–170 μg/dL |
| Ferritin (Male) |
30–400 ng/mL |
| Ferritin (Female) |
15–150 ng/mL |
| TIBC |
250–450 μg/dL |
| UIBC |
150–375 μg/dL |
| Transferrin Saturation |
20–50% |
13. Inflammatory and Acute Phase Markers
| Parameter |
Reference Range |
| C-Reactive Protein (CRP) |
<5 mg/L |
| High-Sensitivity CRP |
<1 mg/L |
| Procalcitonin |
<0.05 ng/mL |
| Ferritin |
15–400 ng/mL |
14. Arterial Blood Gas (ABG)
Acid–Base Parameters
| Parameter |
Reference Range |
| pH |
7.35–7.45 |
| PaCO₂ |
35–45 mmHg |
| HCO₃⁻ |
22–26 mmol/L |
| Base Excess |
-2 to +2 mEq/L |
Oxygenation Parameters
| Parameter |
Reference Range |
| PaO₂ |
80–100 mmHg |
| Oxygen Saturation |
95–100% |
15. Tumor Markers
| Parameter |
Reference Range |
| AFP |
<10 ng/mL |
| CEA |
<3 ng/mL (non-smoker) |
| CA-125 |
<35 U/mL |
| CA 19-9 |
<37 U/mL |
| PSA (Total) |
<4.0 ng/mL |
| β-hCG (Non-pregnant) |
<5 mIU/mL |
References
- Tietz Textbook of Clinical Chemistry and Molecular Diagnostics
- Henry's Clinical Diagnosis and Management by Laboratory Methods
- Tietz Fundamentals of Clinical Chemistry and Molecular Diagnostics
- International Federation of Clinical Chemistry and Laboratory Medicine
- Clinical and Laboratory Standards Institute
- World Health Organization